In order to make games or any application these days it really helps to understand how the debugger works in your IDE. Since this site is all about XNA and specifically XNA Game Studio and the XNA Framework our IDE of choice is Visual Studio / Visual C# Express. For this series the majority of the tips are only available in Visual Studio (denoted by *). This series is going to discuss some cool tips and tricks for debugging our applications. Let's get started ...
Simple Breakpoints
Setting a break point is pretty simple by either clicking in the "Gutter" on the IDE or hitting F9. Doing this will toggle the breakpoint to be present or not.
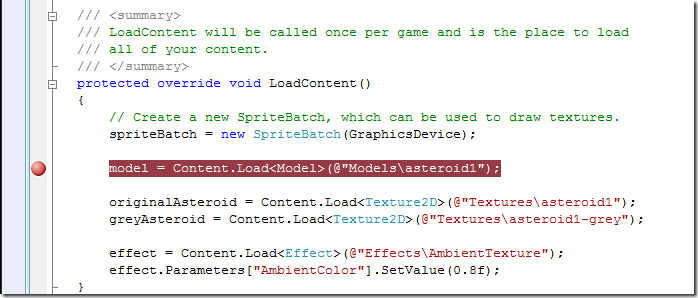
Also we can display debugging information in the output window inside of the IDE. For example, if we use the following code:
System.Diagnostics.Debug.WriteLine("This is my debug message.");
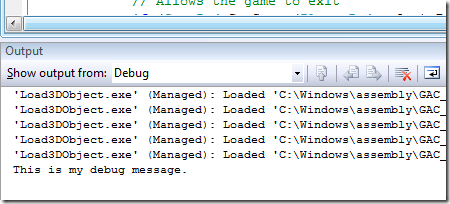
We can see the results printed in the Output window of the IDE:
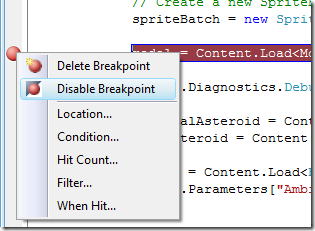
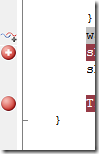
If we want to leave a breakpoint location, but want to disable it we can right click on the breakpoint and choose Disable Breakpoint. (Take note of the other options as we will be discussing them a little later)
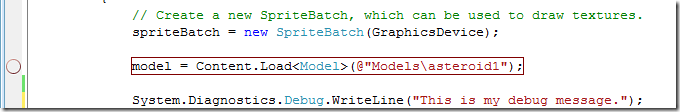
After the breakpoint is disabled it is represented by a circle:
This can be beneficial as well, but we can do better than basic breakpoints and glorified printf statements.
Advanced Breakpoints*
Now we can get to the meat of the tutorial! The first thing to note is that it is best to start the debugging before setting up advanced breakpoints. It is not required, but the benefit is that the symbol tables are available instead of only Intellisense.
The Advanced Breakpoint  allows setting a hit count, a condition or a filter.
Hit Count
To set a hit count, simply right click on a basic breakpoint and select "Hit Count" from the context menu. The following dialog will be displayed:
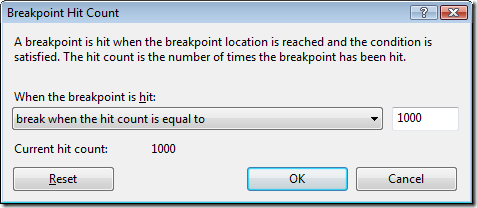
The code will execute skipping over the breakpoint until that line is called 1,000 times.
Here are the options available from the Breakpoint Hit Count dialog box:
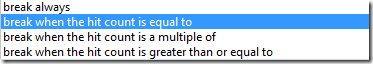
The first option, "break always", describes a basic breakpoint where anytime that code is about to be executed we break into the code.
The second and last options are easy enough to comprehend as the code will only break when the code has been executed a certain number of times.
The third option, "break when the hit count is a multiple of", can be thought of as a modulus calculation. If we used the value 60 for example, then we are asking the compiler to break execution every 60th time the code is executed. For XNA Games this could break the code once a second assuming we were running at 60fps and the break point was in the appropriate method.
Condition
Not only can we specify a hit count for our advanced breakpoint, but we can also specify a condition.
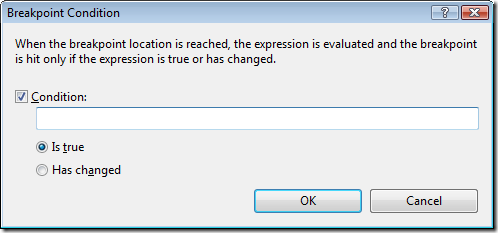
Just as the description reads, this will evaluate the expression entered and will only break if the expression is true or if the expression has changed. An interesting thing to note here is that it actually executes code. For example, if we were in a for loop with a typical index variable of i we could actually cause an infinite loop if we were not careful. In C# we do comparisons by using a double equal sign (==). A single equal sign (=) is used for setting values. So if we wanted to break when our for loop indexer i hit 20 but we put i=20 in the box then every time the compiler executed the expression it would actually set our variable i to 20 effectively causing our for loop to last forever (assuming the condition to break out of the for loop is when i is greater than some value over 20). So be careful to actually use a comparison operator.
An expression can be as simple as a variable. We could simply put in "i" (without quotes) and set the "Has changed" radio button. This would break the execution whenever the variable "i" had a value change.
Methods could even be called from this window. An entire debug class could be created that checks values for nulls or whatever is required. So something like DebuggerHelper.CheckValue(someValue) would be valid assuming that CheckValue returns a boolean type.
Filter
We can also set break points on certain machines, processes and/or threads.
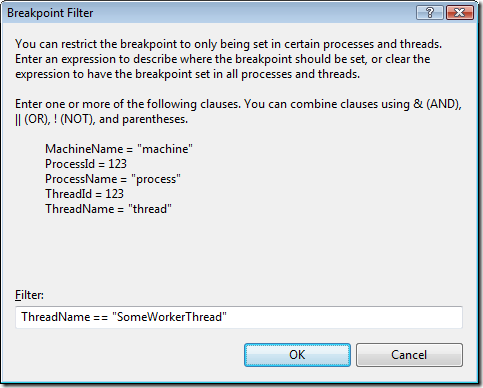
For this dialog, even in C# using a single equal sign is allowed. Fortunately, the typical double equal signs is also allowed. Assuming our application had multiple threads (which can be helpful for long running content loads, etc) we can break the code only when we are in a particular thread. In this example it is assumed we have a thread created and we explicitly named it "SomeWorkerThread". When any other thread executes the code we have set this breakpoint on, the code will not break. However, as soon as the thread we specified hits the code the execution will be paused.
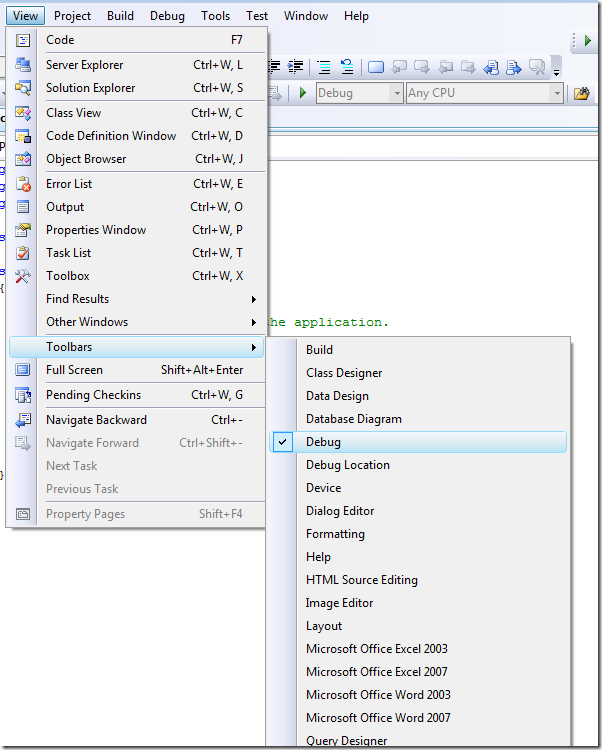
Stepping through threaded code can be aggravating since stepping through the code will jump all over the place if we do not know how to ignore other threads. Fortunately we can do this by making sure our debug toolbar is visible by selecting it from the View > Toolbars > Debug menu item:
This will bring up the following toolbar:
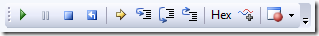
To view the other threads while debugging our code we can select the "Show Threads in Source" button 
Using this toolbar we can also open the Breakpoints window by clicking the "Breakpoints" button 
This brings up the following window where we can more easily manage our breakpoints:
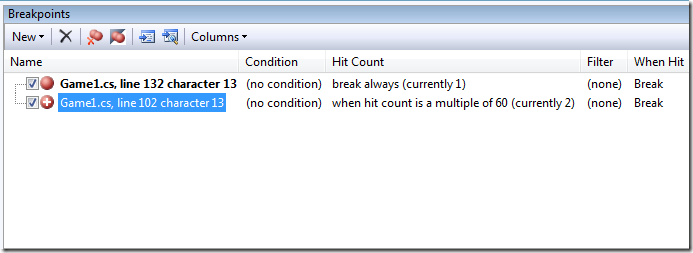
By clicking on the Columns button we can add the columns we want. By default Hit Count, Filter and When Hit are not displayed.
OK, back to our threading issue...
First it would be nice to see all of the threads in the app. Well just like our Breakpoints window we can bring up the Threads window by clicking Debug > Windows > Threads or pressing CTRL + D, T
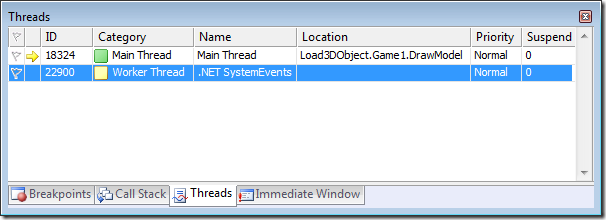
We can see which piece of code our threads are in here. Remember by clicking the button we can see the current location of the running thread by looking at the "Gutter" in the IDE (the same area where the breakpoint icons are displayed).
The last thing to note about Advanced Breakpoints is that Hit Counts, Conditions and Filters are ANDed together. So all conditions need to be met to actually break into the code.
Debugging .NET Framework Source Code*
Sometimes it can be beneficial to actually break into the .NET Framework source code when debugging. Yes, there is Reflector, but you can't exactly step into the code and you can't see the comments. Stepping into the .NET Framework code can be beneficial when some operation is failing (like the system saying a file doesn't exist when it definitely appears it does). By stepping through the code it may actually show that it is really an access denied error.
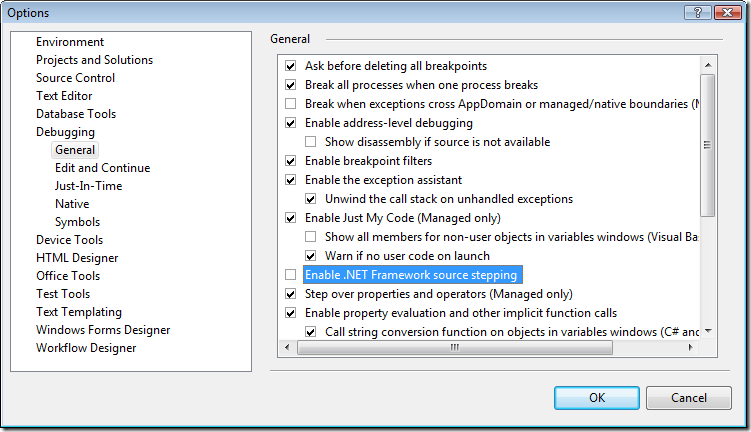
In order to enable the .NET Framework source stepping simply by going to Tools > Options and checking the "Enable .NET Framework source stepping" check box under Debugging / General as shown below:
After getting the dialog box that "Just My Code" is no longer selected you will see another dialog box talking about symbols. To get to the location simply click the Symbols tree node under Debugging.
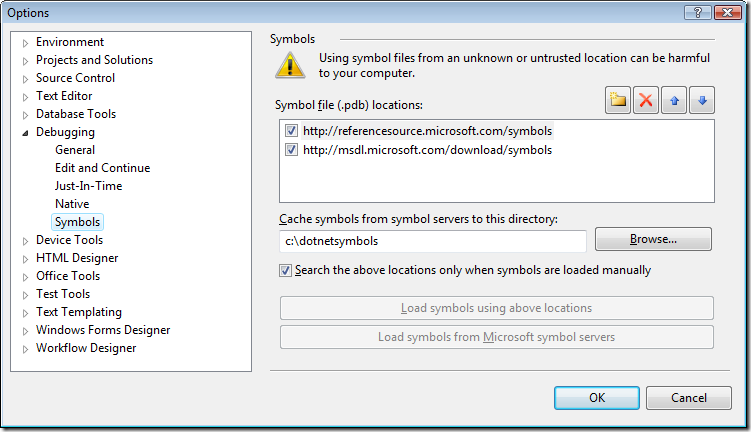
You then need to add the following symbol locations:
http://referencesource.microsoft.com/symbols
http://msdl.microsoft.com/download/symbols
Then in the "Cache symbols from symbol servers to this directory" enter a permanent folder such as:
c:\dotnetsymbols
The next time you debug you will get a dialog box with a EULA for the source code. Instead of only downloading pieces of the framework as you are working on it you may want to download all of it at once. This can especially be helpful if you work offline. There is a codeplex project, NetMassDownloader, that does just that.
Evaluation Windows
While discussing breakpoints we touched on the evaluation of breakpoint conditions. This evaluation functionality is also available in a few other windows as well.
Locals, Auto and Watch Windows
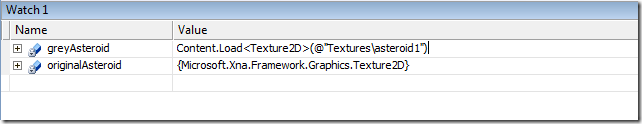
You can add particular variables to the Watch window. The Locals and Auto windows are populated / depopulated based on the scope of the application. You can click in the Value column and modify the value. This doesn't only work for value types but it also works for reference types. For example the texture greyAsteroid has a value assigned to it, but I am redefining it at runtime by typing in Content.Load<Texture2D>(@"Textures\asteroid1") in the Value column and pressing enter.
It is also legal to just create a new object. For example entering new SomeClass() would be a valid entry for the appropriate variable.
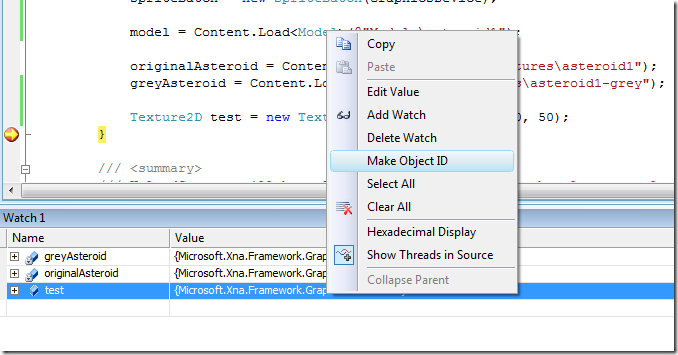
There is a little know feature called Make Object ID*. Simply right click on the row with a reference type and select Make Object ID.
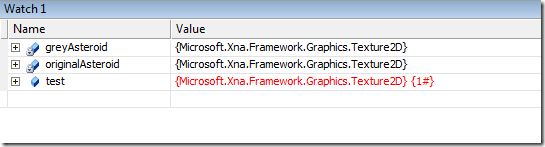
It will then associate an object id, for example {1#}, to the object. Since both my greyAsteroid and originalAsteroid variables are both member fields I knew they wouldn't go out of scope so I created a temporary test variable. When I create an Object ID for this variable I now have the following:
Now the benefit of creating an Object ID is that I can see the memory even after it goes out of scope. I just need to type 1# as a new Watch item. Doing this and then stepping out of the method gives me the following results:
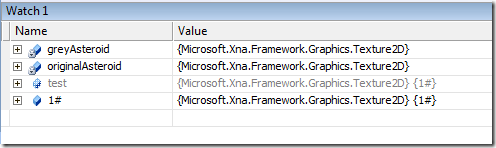
Notice the test object is out of scope and it is grayed out. Yet, I still have access to the object id. I can continue to look at the memory until the garbage collector runs. I'm not guaranteed how much longer it will be around, but this can be handy in advanced scenarios.
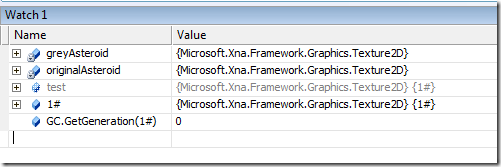
We can even check to see what generation the of the garbage collector the variable is in. We can add GC.GetGeneration(1#) in the Watch window and see the following result:
That is pretty cool!
Immediate Window
For the command link junkies there is the Immediate window. This is actually my favorite window. Just like the others you can evaluate expressions. You can also create new objects that you can evaluate at runtime. For example, you can type in
? SomeClass x = new SomeClass();
And then in the Watch window you can watch the value by entering $x. Now not only can we set simple value types like bool, int, float, etc but we can create a new reference type and then set a value in our code to that new reference while debugging. This can also come in handy.
By the way, ? comes from the Visual Basic days and is short hand for print.
Summary
We discussed basic breakpoints, advanced breakpoints with filters, hit counts and conditions. Hopefully there was information in here that you didn't know existed. This can really help speed up development.
Well that is enough information to think on for this blog post. In the next installment I will walk through creating a Visualizer for Visual Studio.
* Not available in Visual C# Express
Happy Debugging!
Chad